Each Cartesian chart type (column, bar, line, and area) supports several different ways of displaying the information. These methods have specific preset parameters that make the display useful for different requirements. The displayed color depends on the selected theme. These can be changed in the Design tab.
Design Presets
Select the Cartesian chart type from the Visualization menu.
Chart Design is NOT available for the following types:
Marimekko Chart
Open High Low Close Chart
Box & Whisker Chart
Waterfall Chart
Tornado Chart
Stream Area Chart
Stream Spline Chart
Stream Step Chart
Preset Examples
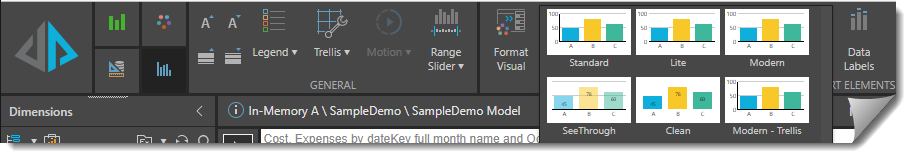
The preset versions of each of the Cartesian chart types is located on the ribbon's Components tab
The examples are from the Column chart .
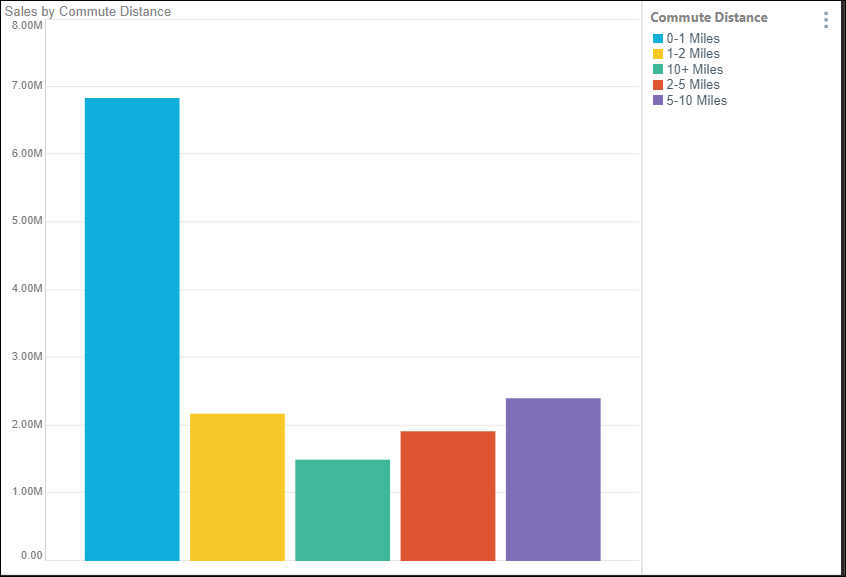
Standard
A popular format displaying the most-commonly used information. The chart title is displayed on the left, and the Legend on the right. Data Labels, displaying the actual values are not displayed.
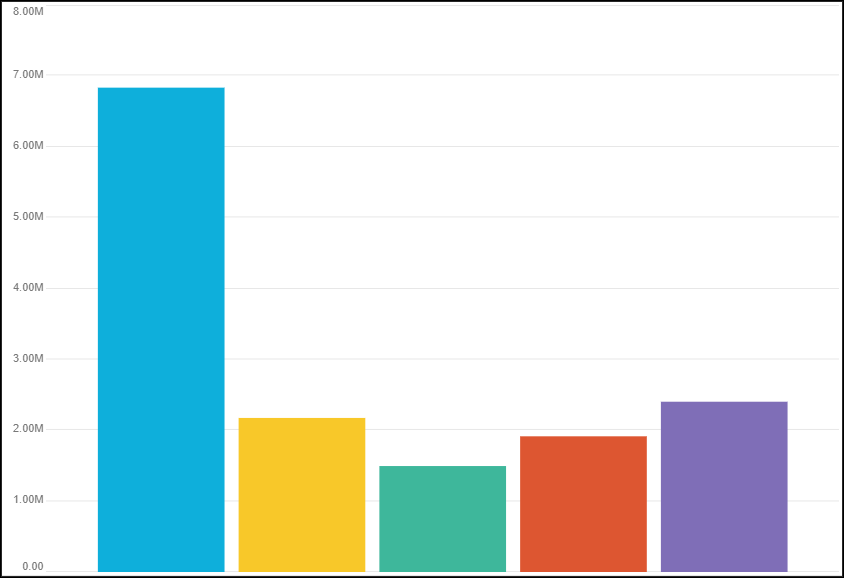
Lite
A compact format that is perfect for basic, quick comparisons. The chart title, Legend, and. Data Labels are not displayed.
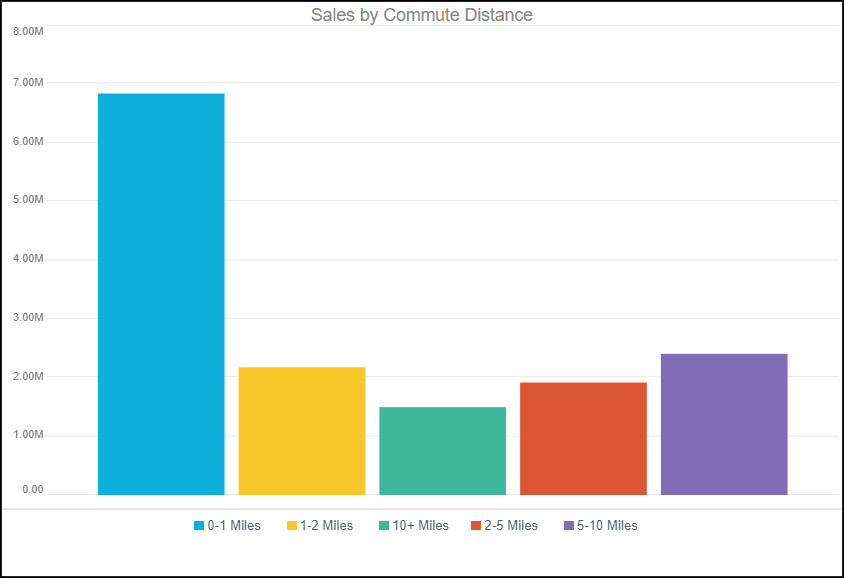
Modern
A sharp and compact chart displaying a centered report title and the Legend on the bottom
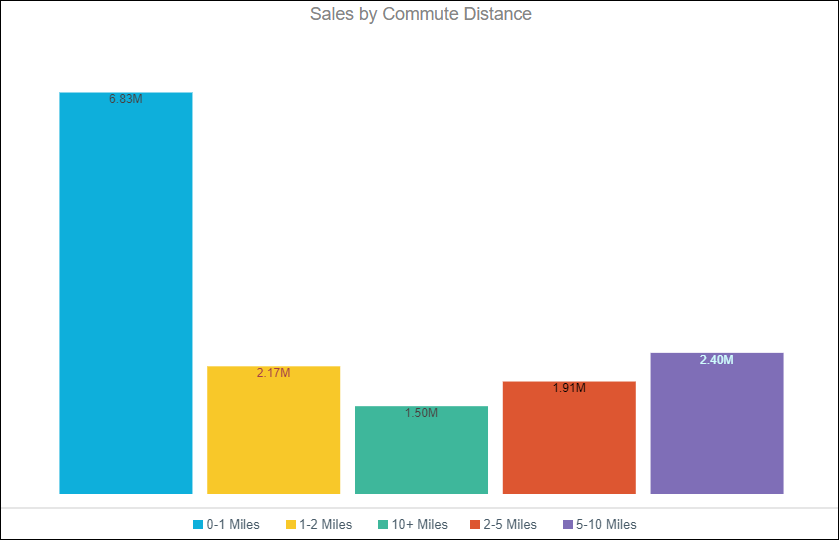
SeeThrough
A modern, transparent design with preset translucent colors. You can edit the opacity manually in the Theme Editor. This design includes a centered report title and Legend on the bottom. Data Labels are displayed on each column.
![]()
Clean
A clean design. This design includes a centered report title, Legends on the bottom and Data Labels. There are no background "Y-axis" lines.
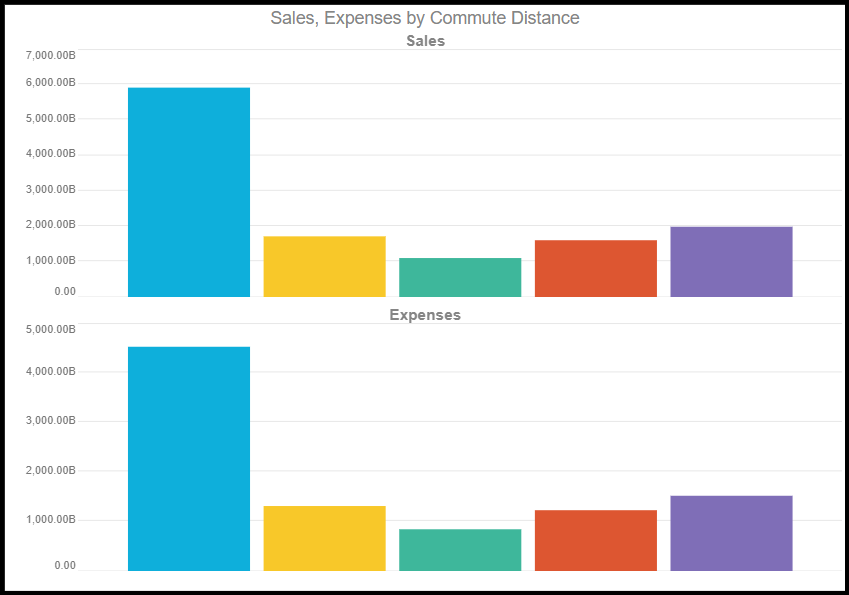
Modern-Trellis
A Lite chart that allows the display of multiple charts side by side so that comparisons can be made. For more information, see Custom Trellising. This Chart has a centered title, but no Legend or Data Points.